
Built From Notes, Patterns, and Data Questions
Available on all devices


30-days refund guarantee
Data Learning Routes for Different Starting Points
-
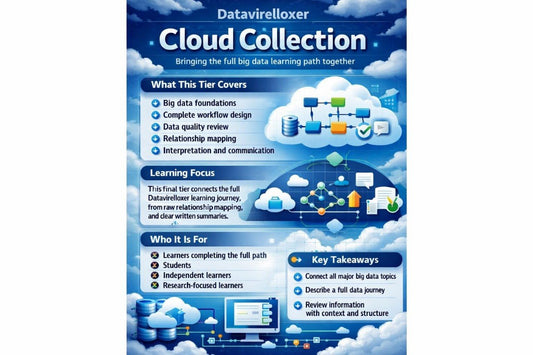
Cloud Collection
Regular price €492,00 EURRegular price -
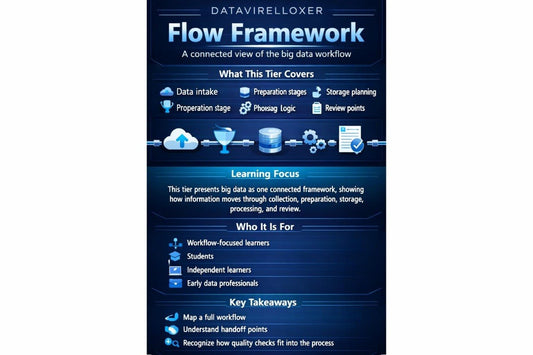
Flow Framework
Regular price €196,00 EURRegular price -
Frame Series
Regular price €172,00 EURRegular price -
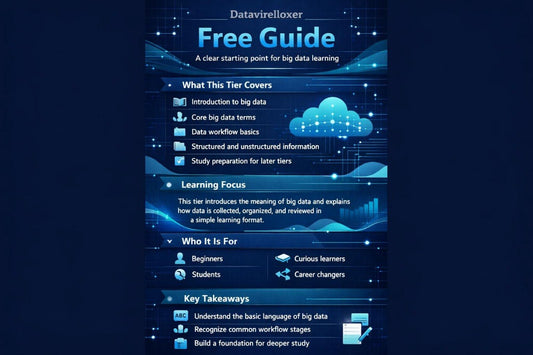
Free Guide
Regular price €0,00 EURRegular price -
Lattice Collection
Regular price €301,00 EURRegular price -
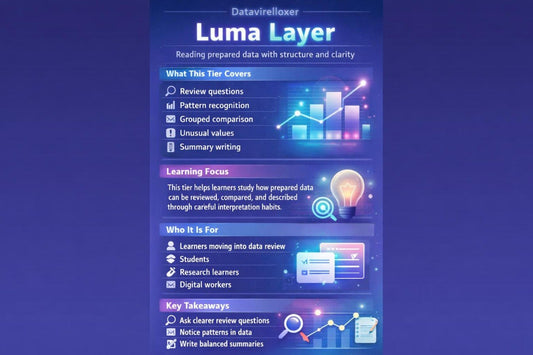
Luma Layer
Regular price €202,00 EURRegular price -
Nexus Library
Regular price €214,00 EURRegular price


Turning Large Data Ideas Into Clear Learning Paths
The People Behind the Data Pages
-

Otto Stellan
Data Workflow Mapper
Otto creates visual maps that explain how information moves through data systems. He studies intake points, preparation steps, storage sections, processing stages, and review outputs. His work helps teams see the full path of data in a structured way.
-

Luke Marshall
Big Data Reporting Specialist
Luke prepares written and visual reporting materials based on reviewed data. He focuses on clear summaries, careful observations, and organized report sections. His work helps make large data findings easier to read and discuss.
-

Betty Larkin
Data Operations Researcher
Betty studies how large data workflows support daily digital operations. She reviews process notes, dataset movement, and recurring information patterns. Her work helps describe how data tasks are arranged and improved over time.


Start With a Free Data Learning Guide
What Learners Can Take From the Data Trail
-

Clear Structure
Our course materials divide big data topics into organized sections so learners can follow each idea with more direction.
-

Practical Examples
The lessons include realistic data study situations that help explain how concepts may appear in learning and workflow contexts.
-

Offline Study
The downloadable materials can be saved and reviewed offline, making it easier to study at a comfortable pace.
-

Careful Wording
Datavirelloxer teaches data review and interpretation with balanced language, helping learners describe observations without overstating them.
Preview the Datavirelloxer Course Library
Stories From the Datavirelloxer Learning Path
-

Tomas Stankovic
Tomas was working around reporting tasks and wanted a clearer way to understand how data moves before it becomes ready for review. He had seen charts and summaries before, but wanted to study the earlier stages such as intake, preparation, storage, and quality checks. The workflow explanations were useful because they showed how each stage connects to the next in a calm and readable way.
“The course helped me see why preparation and review points matter before writing data notes.” -

Lucy Tierney
Lucy started with curiosity about big data but felt unsure about the meaning of common terms such as structured data, metadata, data quality, and workflow stages. She wanted materials that could be studied offline and reviewed more than once. The downloadable format and clear module layout helped her return to specific sections whenever she needed to revisit an idea.
“The structure made it easier for me to study one topic at a time and connect it with the next.” -

Rally Brodeur
Rally came with experience reading reports, but she wanted a better understanding of how observations are formed from prepared data. She was especially interested in careful interpretation, grouped comparison, and summary writing. The review-focused sections were useful because they explained how to describe patterns with context and avoid overstating what the data shows.
“I appreciated the balanced wording and the focus on careful data review.”


As seen on

